Using ZIP code data for personalized insights, better navigation

Over five years ago, we partnered with the Boston University School of Public Health to gain a deeper understanding of the most pressing health and well-being challenges across America at a hyperlocal level, thereby advancing our ability to deliver the right interventions to the right people at the right time. Through the Sharecare Community Well-Being Index, our ongoing measurement of well-being across the U.S., we assess well-being and health risks across populations through the lens of individual well-being factors—physical, financial, social, community, and purpose—as well as more than 1,000 elements of social determinants of health (SDOH), including food access, resources, healthcare, economic security, and housing and transportation. Covering all U.S. states, every Census-designated metropolitan statistical area, and all counties nationwide, we designed our Index to lay the groundwork for interventions that address systemic and population-based inequities, SDOH, and more.
Building on this foundation, our latest research, published in Scientific Reports, introduces an analysis at the ZIP code level – a new approach that allows us to explore health disparities with an even more localized perspective. By using statistical models that account for local differences and the mobility between areas—often determined by factors like driving times rather than just geographic proximity—we can now pinpoint specific local health challenges and tailor our interventions more precisely. This not only maximizes the impact of our initiatives but also gives our partners across the healthcare ecosystem—ranging from employers to payors to community organizations—the data and prescriptive solutions they need to meet each individual where they are.
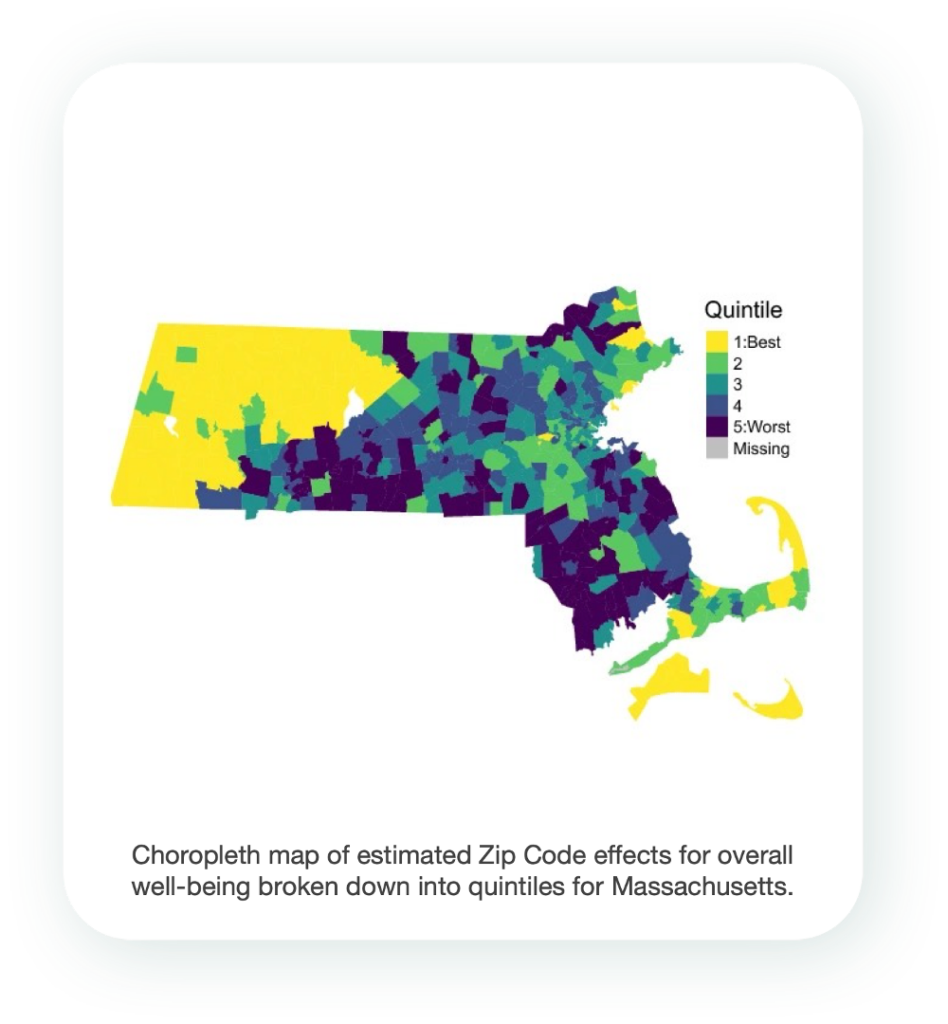
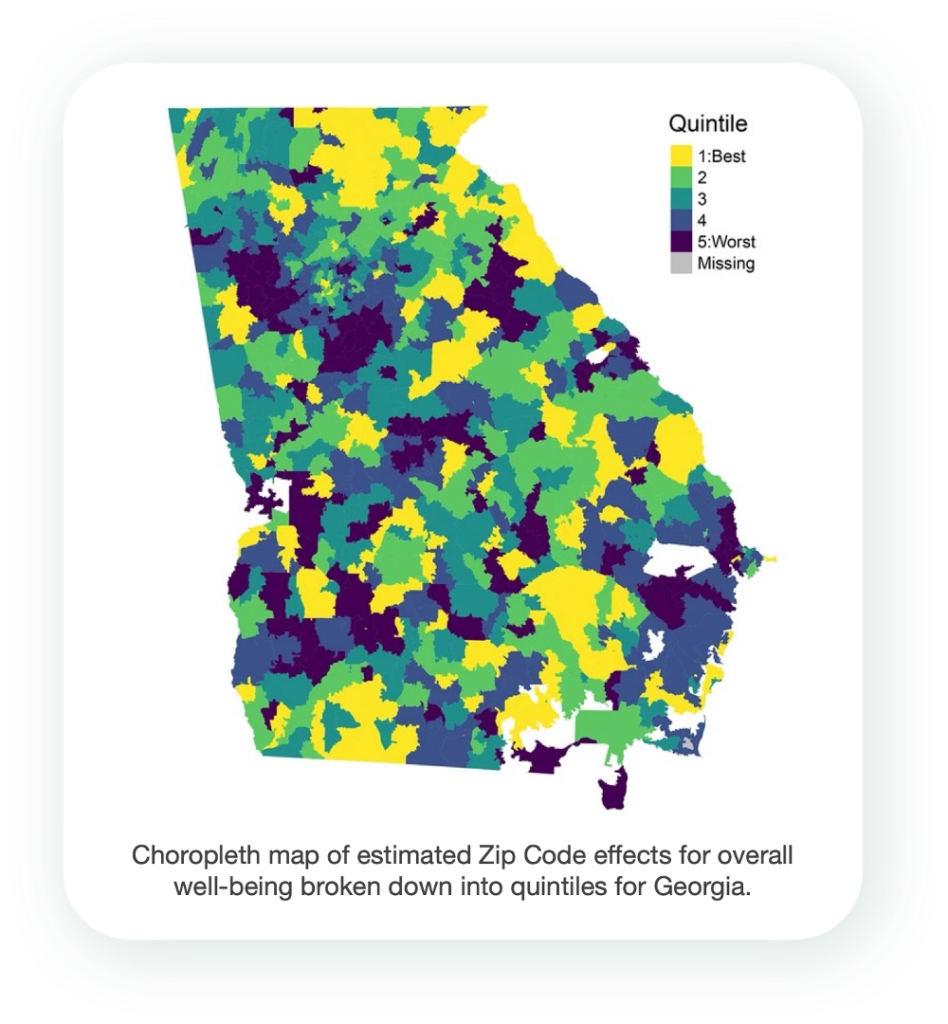
Drawing from the Sharecare Community Well-Being Index sample of nearly 5,000,000 individuals collected through our digital platform, we developed a statistical modeling framework to analyze how factors like age, income, and education impact well-being in each specific ZIP code, while also considering the influence of nearby areas. For this analysis, we focused on two states: Massachusetts and Georgia.
What we found:
- Education and income: In both Massachusetts and Georgia, higher levels of education and income were consistently associated with better well-being. Individuals with higher education and income tended to report higher well-being scores, indicating a positive correlation between socioeconomic status and well-being. For instance, in Massachusetts, compared to those with less than a high school education, individuals with a college degree experienced an average increase in overall well-being by about 8.2 units, holding other factors constant. Similarly, those earning over $100,000 annually experienced an increase in overall well-being by 13.7 units compared to individuals earning less than $25,000. In Georgia, the impact is also evident. Georgians with a post-graduate degree experienced an increase in well-being by 7.1 units over those with less than a high school degree. Further, an income of $100,000 or more was associated with an 8.7 unit increase in well-being compared to incomes under $25,000.
- Geographic trends: In Massachusetts, ZIP codes near Boston, as well as some ZIP codes on Cape Cod and western Massachusetts, demonstrated elevated well-being scores. Conversely, ZIP codes in central Massachusetts near cities such as Worcester, exhibited the lowest average well-being scores. In Georgia, the northern part of the state exhibited the highest average well-being scores, while ZIP codes south of Atlanta and in the southwest part of the state demonstrated the lowest average scores, highlighting geographic disparities in well-being within states.
- Social well-being: In Georgia, married individuals tended to report higher social and community well-being scores compared to those who were unmarried, indicating the importance of social connections and support networks in promoting well-being.
These findings underscore the importance of considering both individual-level data and geographic variations when addressing health disparities. With this, we can tailor interventions to meet the unique needs of each community. Looking ahead, we are excited to use this as part of our Index, accounting for the fine-grained disparities that can exist between adjacent ZIP codes, where access to resources such as schools, healthcare, and food can vary significantly. This also allows us to measure the direct impact of localized health interventions over time. By tracking changes in well-being indicators at the ZIP code level, we can better assess the effectiveness of our strategies and adjust our methods in real time.